Every time I encounter a need to provide an impact statement or when I read for-impact studies, I get an ick because ‘impact’ and ‘science’ are barely related and often contradict each other. You can make a lot of impact without science. You can do science without any impact. Moreover, if you are doing science for impact, you are not doing science at all. Focus on the impact changes the subject from understanding to manipulation and, most importantly, compromises the method, which is a core of science.
Category Archives: blog
Naming measurement instruments
Although name Trikon reflects its owner's triangularity, Glopnik sounds way better.
When I first started studying psychology, I believed that the labels attached to psychological scales are trustworthy. Under this impression, I employed the scales based on what their names claimed to measure. Little did I know the labels and the content of scales are not (directly) related. Since then I lost my belief in scale names and simply skip to the items to get at least some idea of what it might be measuring.
Jangle happens
Jingle-jangle fallacy has been raised so many times by this moment. To give a heads-up: jingle happens when you mistakenly buy an almond milk instead of a normal milk: both are named “milk” but have almost nothing to do with each other. Jangle happens when you order aubergine at a restaurant but they serve you eggplants—different names, same vegetable.
Imagine you are trying to test criterion validity of your new Eggplant scale using an allegedly different Aubergine scale. How frustrating it is to realize that it’s the same thing and your attempt to prove validity generally fails because of that.
Presentation of our new paper on social status of older people around the world
Rudnev, M., & Vauclair, C. M. (2022). Revisiting Cowgill’s Modernisation Theory: Perceived Social Status of Older Adults Across 58 Countries. Ageing & Society https://doi.org/10.1017/S0144686X22001192 Full text
Abstract
Cowgill’s modernisation theory stipulates that older people’s social status is lower in societies with higher societal modernisation. The few existing studies reveal conflicting results showing either negative or positive associations. The current study follows up seminal cross-national research on the perceived social status of people in their seventies (PSS70) in a diverse set of countries. PSS70 was defined as the relative status of people in their seventies compared to people in their forties. Data were obtained by the World Values Survey (2010–2014) and included 78,904 respondents from 58 countries. Multilevel regressions showed that the level of modernisation had a strong and negative association with the PSS70 but mostly due to one component, namely the share of older people in society. The associations were more complex when considering cultural zones of which two stood out. Irrespective of level of modernisation, Muslim countries showed higher and post-communist countries showed lower levels of PSS70. In Muslim countries, modernisation had a near-zero association with PSS70, whereas it was strongly negatively associated with PSS70 in post-communist countries. This study generally supports Cowgill’s theory in a large and diverse cross-sectional sample of countries, yet it also illustrates its cultural boundary conditions.
Alignment method for measurement invariance: Tutorial
It’s been a while since measurement invariance alignment has been introduced in 2014, but not that many researchers applied it in practice. Among ~200 citations (as of May 2019) of the original alignment paper there were only a few substantive applications. It is a pity because you can always enjoy more optimistic results with alignment as compared to the conventional (frequentist, exact) measurement invariance techniques. I guess, it’s been happening due to statistical complexity and a lack of simple guidelines. In this post I summarized, in an approachable way, the steps that are necessary to apply alignment procedure. In addition, I provide couple of R functions which automate preparation of Mplus code and extraction of useful information from the outputs.
Updates:
[August 23, 2023]: Please note this tutorial was based on Mplus version 7.3. Since then, Mplus developed many new features related to alignment and even introduced a new alignment-inspired class of models called penalized SEM. [February 26, 2022]: Some minor errors were fixed. [November 13, 2020]: The post was updated to make it fully reproducible.
Contents
Intro Step 1. Find an acceptable configural invariance model Step 2. Set up “FREE” alignment model in Mplus Step 3. Set up “FIXED” alignment model Step 4. Interpret the “Approximate measurement invariance” output Step 5. Interpret “FACTOR MEAN COMPARISON” output Step 6. Interpret “ALIGNMENT OUTPUT” output Step 7. Checking the reliability of the results with simulation Example Mplus files Additional options (Bayesian estimation, estimation fine tuning, extra mean ranking table, fit function contribution, categorical indicators) Software, including automation in R Resources
In defense of cross-sectional studies
Peter Molenaar’s widely cited paper and a recent Fisher et al. (2018) claim that between-individual differences that are often used to explain within-individual processes cannot be used for this purpose, or at least may invoke a large bias. In some students and researchers, this article created a false impression that between-individual (or cross-sectional) studies are totally useless in arguing about within-individual processes. In this post, I claim that cross-sectional studies aren’t useless and sometimes are the only possible way to find out about within-individual processes.
Imagine a person who has been raised religious, always goes to church every Sunday, and prays every day before sleep. Imagine also that this particular person is also strongly against abortion. A typical longitudinal study would measure her religiosity and her attitudes toward abortion multiple times during, say, five years, and then test if there is a correlation between change in a level of religiosity and change in a level of the attitude. If the person’s religiosity hasn’t changed, the classic longitudinal study would efficiently estimate zero relations between these variables because one of them is constant. The fact that religiosity has been constantly high for five years by no means implies it doesn’t influence attitudes. My point is that the longitudinal study might detect relations between variables that change, and totally useless when it faces no within-individual change. Therefore, within-individual designs aren’t almighty in discovering within-individual processes. In my example, a between-individual design is the only way to find out about what might be going on within an individual. We would see that more religious individuals are less in favor of abortions, and may theorize that a constantly high level of religiosity leads to a constantly negative attitude to abortion.
Following Judea Pearl, in order to make a valid conclusion, we have to overcome a mere observation of associations (which he treats as a lowest level of inference). To be able to make valid inferences, we have to imagine and reason the counterfactuals, i.e. the events that have not happened. In my example, the person’s low level of religiosity is counterfactual, but we can infer what would happen if it were the case – and the only way to do this is to use cross-sectional, between-individual data. As I noticed above, within-individual designs are limited to features that change. My guess is that more stable features of person and personality (such as values, personality traits, gender, social class) tend to affect behavior and attitudes in much much higher degree than characteristics that change. Indeed, important things don’t change fast, that’s why they are important! Therefore, between-individual studies might well be even more powerful than within-individual studies in discovering and explaining within-individual processes.
These limitations of within-individual designs apply to surveys as well as to experiments; additional limitation of experiments is that we cannot manipulate most of things, and those we actually can aren’t very powerful forces.
Of course, we have to have in mind that between-individual designs describe first of all between-individual differences, and only with some serious assumptions (which we have to explicate and reflect on) they may suggest a course of within-individual processes. The main assumption here is that a sample of individuals represents a sample of states of a single individual. Whether this assumption is reasonable or not is subject to discuss, but we shouldn’t blindly deny the use of cross-sectional designs in studying within-person processes. It might be a substantively driven decision in studies of within-person processes, going beyond organizational concerns.
Schwartz circle in ggplot2
Since 2008 I draw Schwartz value theory in a form of circle unaccountable number of times, and there were very different versions, with more or fewer circles inside, in different languages and with different emphases. I used PowerPoint, Word, Excel, Paint, even Photoshop once. Here is not the optimal but quite universal and customizable solution. UPD. Now it’s a function schwartz_circle() in my R package LittleHelpers.
Branching pipes
Here are three little functions that allow for brunching logical pipes as defined in magrittr package. It is against Hadley’s idea, as pipes are in principle linear, and in general I agree, but sometimes it would be comfy to ramify pipes away. It overcomes native magrittr %T>% by allowing more than one step after cutting the pipe. Imagine you need to create a list with means, correlations, and regression results. And you like to do it in one single pipe. In general, it is not possible, and you’ll have to start a second pipe, probably doing some redundant computations. Here is an example that allows it:
data.frame(a=1:5, b=1/(1+exp(6:10)) ) %>%
  ramify(1) %>%
    branch(1) %>% colMeans %>%
    branch(2) %>% lm(a ~ b, .) %>% broom::tidy(.) %>%
    branch(3) %>% cor %>%
      ramify(2) %>%
        branch(1) %>% round(2) %>%
        branch(2) %>% psych::fisherz(.) %>%
      harvest(2) %>%
  harvest
ramify()- Saves current result into temporary object.bufand identifies a point in the pipe where branching will happen. Argument is an id of ramification.branch()- Starts a new brunch from theramifypoint. (brunch(1) can be omitted, as ramify creates the first brunch. Second argument is a family of branches, or parent branch. By default it uses the last parent branch created by last usedramify.harvest()- Returns contents of all the brunches as a list and clears the buffer.
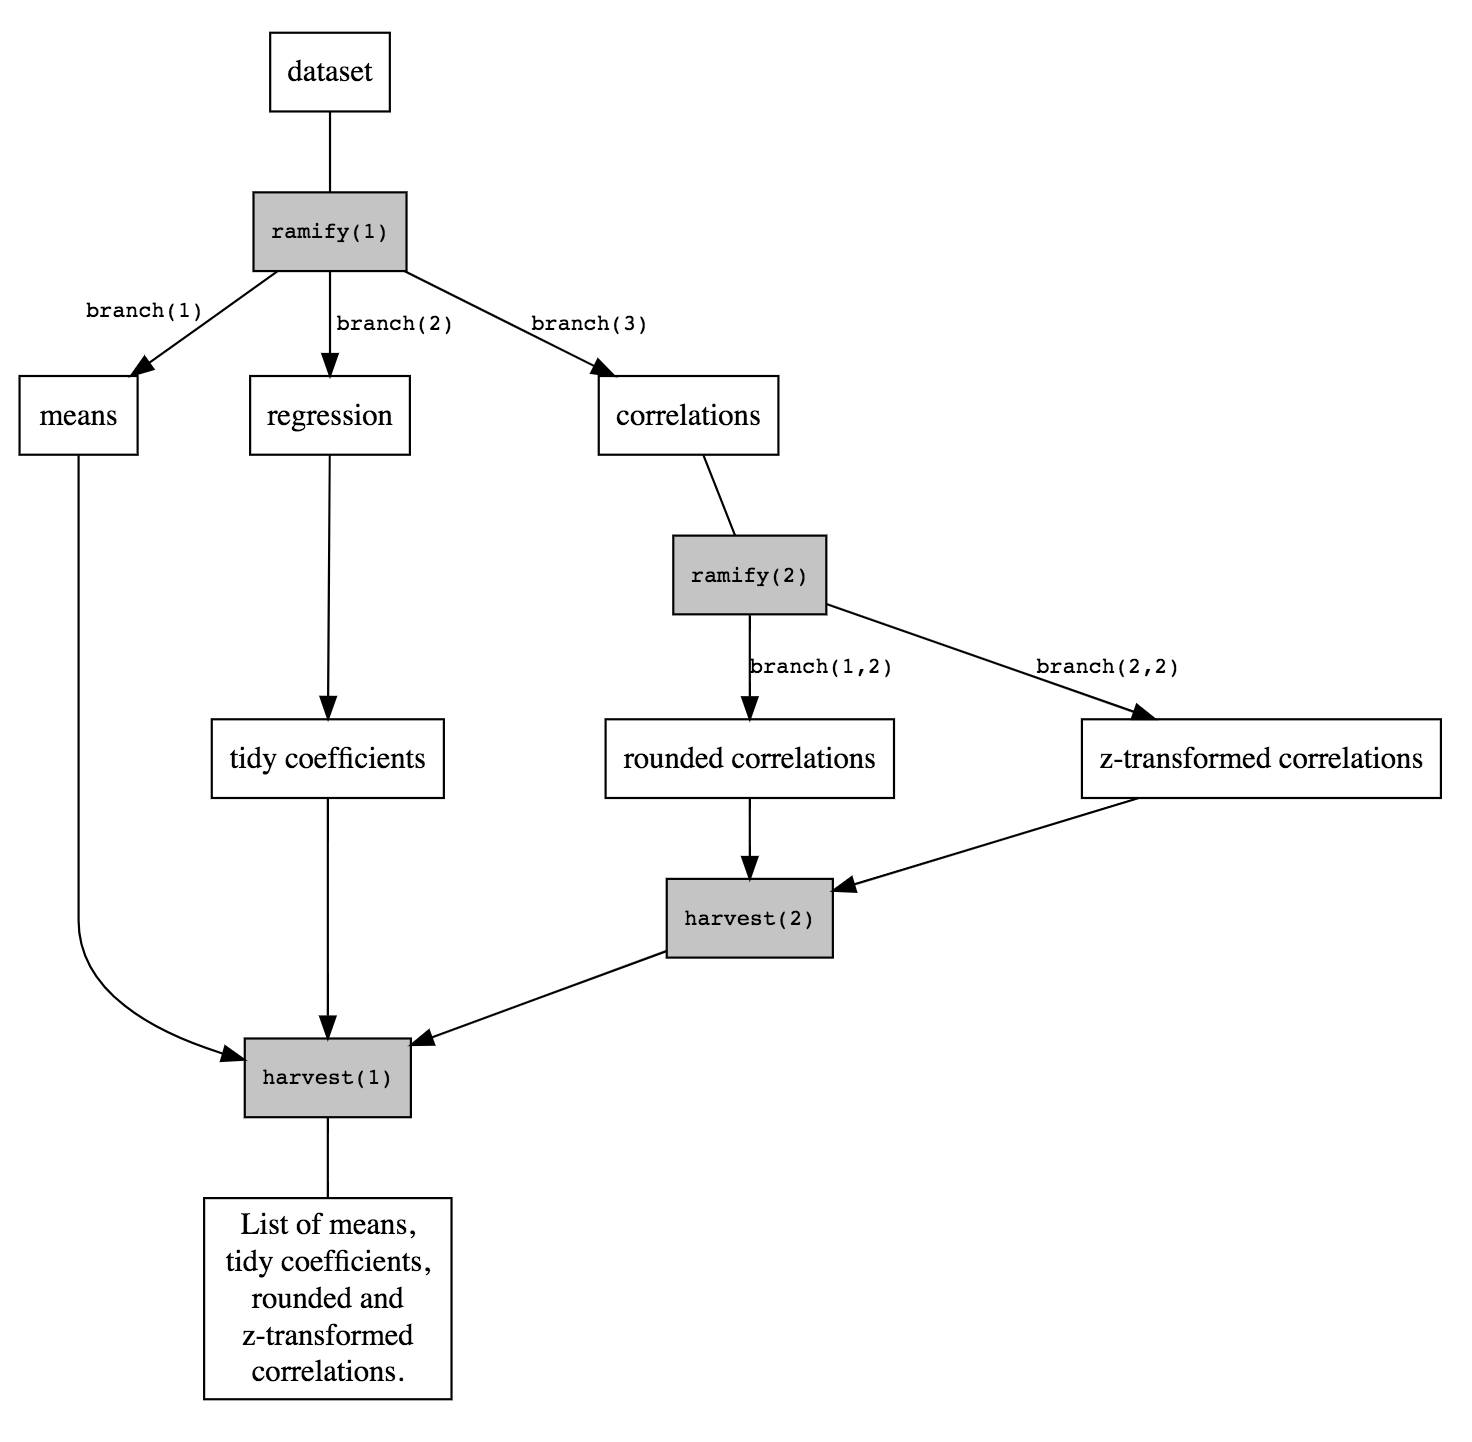
See proof of concept https://gist.github.com/MaksimRudnev/bf81eab9f39bd830f9f167c669444472
“Pipes are fundamentally linear and expressing complex relationships with them will typically yield confusing code.” http://r4ds.had.co.nz/pipes.html#when-not-to-use-the-pipe
'n'go
savengo is ridiculously simple but potentially useful function that saves objects from a middle of your pipe and passes the same object to further elements of the pipe. It allows more efficient debugging and less confusing code, in which you don’t have to interrupt your pipe every time you need to save an output. Its sister function appendngo appends an intermediary product to an existing list or a vector. By analogy, one can create whatever storing function they need.
# Example 1
#Saves intermediary result to an object named intermediate.result
final.result <- dt %>% dplyr::filter(score<.5) %>%
                        savengo("intermediate.result") %>%
                        dplyr::filter(estimated<0)
# Example 2
#Saves intermediary result as a first element of existing list
final.result <- dt %>% dplyr::filter(score<.5) %>%
                        appendngo(myExistingList, after=0) %>%
                        dplyr::filter(estimated<0)
See proof of concept https://gist.github.com/MaksimRudnev/bf81eab9f39bd830f9f167c669444472
Little function to download ESS data on the go
Motivation
Yes, there is a recently published brand new R package ess for downloading European social survey data, I tried it, although at this point it is quite limited. What are the good sides of ess package?
- it downloads data, sometimes several data at a time
What’s not so good?
- when it downloads several rounds, you get a list of data instead of integrated dataset;
- it can only download one country data at a time;
- it tuned up for use in Stata, but not in R, for example, I couldn’t see most of the value labels.
So, I thought it would be useful to have a customizable function (instead of package) to do the same thing, but better. For example, you can keep labels to use, for example, with my label_book.
Details
Don’t put more than one country or more than one round - it won’t work. For countries, use iso2c codes, or “all”. This function will expire when ESS updates its data versions, but it happens about twice a year, and can be fixed manually.
Examples
#1. Source the function
eval(parse(text =getURL("https://raw.githubusercontent.com/MaksimRudnev/LittleHelpers/master/download_ess/download_ess.R")))
#2. Enjoy it
ESS2 <- download_ess(round=2, country="all", "mymail@gmail.com") #Add your registered on ESS website mail here
ESS6.Russia <- download_ess(round=6, country="RU", "mymail@gmail.com")
Function itself
Label book for R
Sometimes, when you explore a new dataset, variable names don’t make much sense. In SPSS you would just look at the labels, in R it’s not that straightforward: checking codebooks all the time is tedious, reading a questionnaire and trying to guess which variable corresponds to each question is even less reliable. If your data has labels as attributes, or you have read .sav datafile into R with haven or foreign package, it would be handy to have a searchable table of all the variable and value labels in the dataset. I looked it up and didn’t find such a function, so I have written a little simple function myself. UPD. Now this function is a part of my R package LittleHelpers.
Explore values in Europe with Shiny App
After I have conducted the same kind of descriptive statistics for the thousandth time I realized the world needs a simple tool to explore value levels across years and countries. The tool is purely exploratory, don’t forget about comparability and measurement invariance problems. My website is hosted by Wordpress which sucks in embedding stuff, so you have to click the link: http://apps.maksimrudnev.com:3838/shiny_values/ There are three tabs to explore trends by country, which allows comparison of value trends within each country, by value - to compare countries, and value map to see all the countries as points in the space of two higher order value dimensions. Point you mouse at country point on the value map to see how they moved during the measurement period. Below are some screenshots. 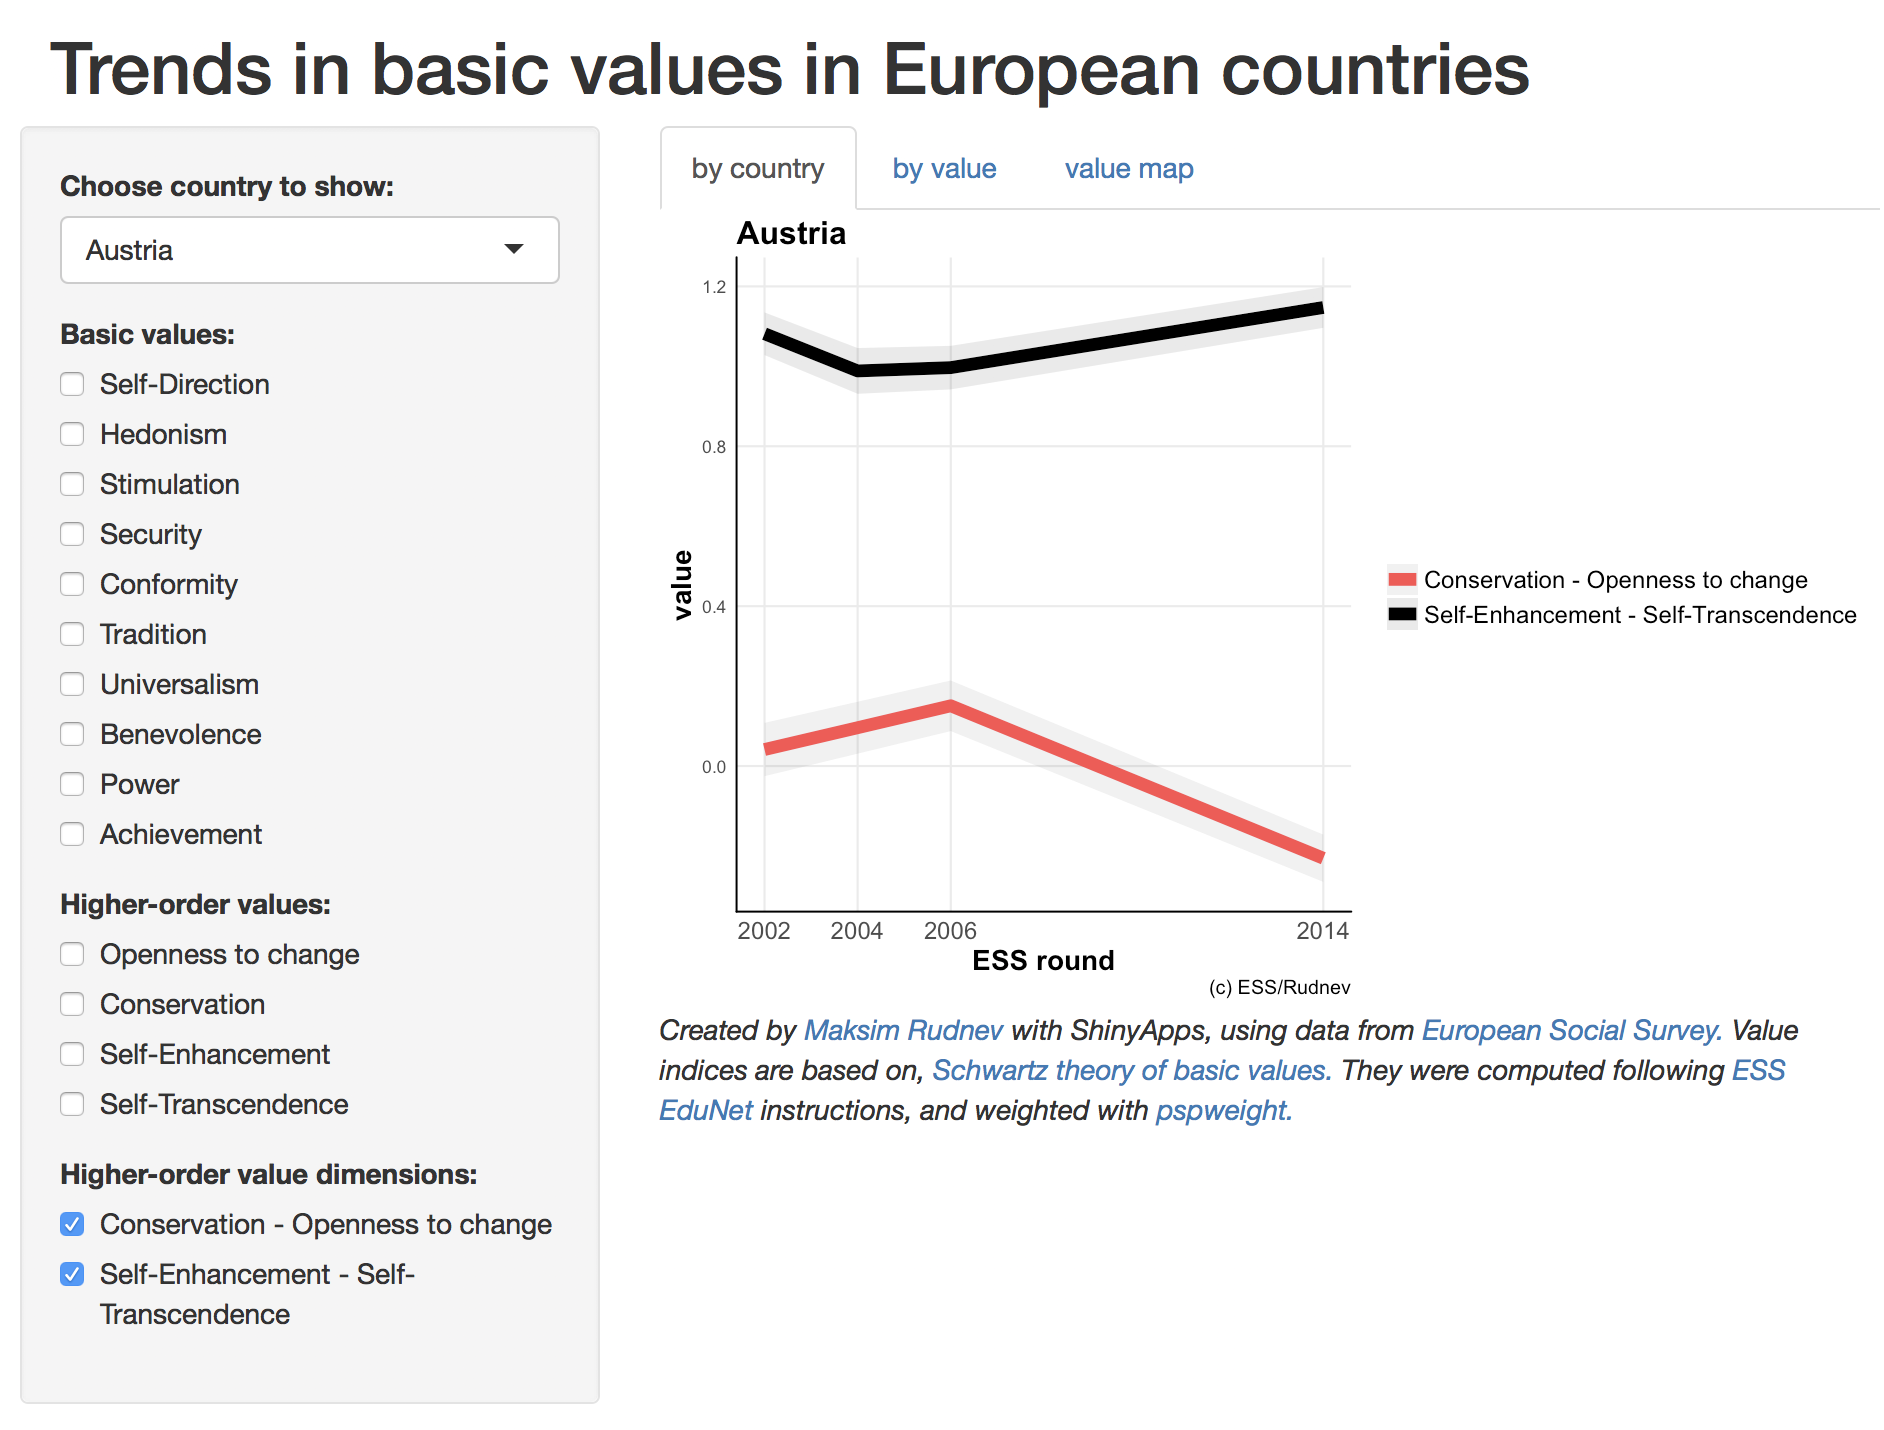
Conflict of interest in social science
There is one great thing about medical and epidemiological research - declaration of the conflicts of interest. Medical researchers, usually before they actually present any research results, declare that they are not biased by financing or obligations to pharmaceutical companies, to producers of devices, commercially promoted ways of treatment, or anything like this. However, social scientists do not bother with such nuance. Not-so-smart ones would claim they try to be objective. Smart ones would say: “Of course we’re biased”, but would never reflect in their articles in which way (and editors would not accept such papers). Given the neo-positivist ethos of the leading journals in sociology and social psychology, conflict of interest (or researcher’s personal bias) can undermine many conclusions without even acknowledging it. Especially when a researcher has so many degrees of freedom. It looks totally outdated, as if we haven’t had all these anti- and post-positivisms, or critical theory. Haven’t every reader thought about comparing consistent results of some prominent scholars of, for example, values and moral attitudes with their personal views? We can try to avoid this bias statistically, but we cannot easily reshape the way we think, so the least we can do is a declaration of researcher’s personal opinions added to every article. Of course, this is a very personal stuff, but I think it would greatly amend a positivist pathos of many, many articles.
"The Psychology of Human Values" by Gregory Maio
There is a great new book on the market about basic values. For academics, it’s a new point of reference after a long time (for me it was Hitlin & Piliavin, 2004). It’s also great for newbies and anyone who’s just developed their interest in basic values. It sorts things out about what values are, what they depend on, what they can influence, whether they change, or can be manipulated. Gregory Maio did a great job in summarising much of the recent studies. CONTENTS The Problem of Human Values. Section 1: Beginnings in the Empirical Study of Human Values 1. A brief history of values 2. Types of values. Section 2: Values in Psychology 3. Connections to motives, traits, and habits 4. Connections to ideology and attitudes 5. Components of values. Section 3: Forces that Shape Values 6. Personal influences on Values 7. Social influences on Values. Section 4: When and how values matter 8. Effects on prejudice and well-being 9. When values matter 10. How values matter. https://www.routledge.com/The-Psychology-of…/…/9781841693576
Ways to do Latent Class Analysis in R
The best way to do latent class analysis is by using Mplus, or if you are interested in some very specific LCA models you may need Latent Gold. Another decent option is to use PROC LCA in SAS. All the other ways and programs might be frustrating, but are helpful if your purposes happen to coincide with the specific R package. CRAN offers plenty of different ways to get clusters on your data, but most of these packages have a very narrow and specific utility. For example, I found at least 15 packages involving latent class models, of which only six perform latent class analysis in the form of classification based on indicators, and only two of them allow including nominal indicators, and none allows including ordinal indicators.
"Church attendance" question in WVS-5
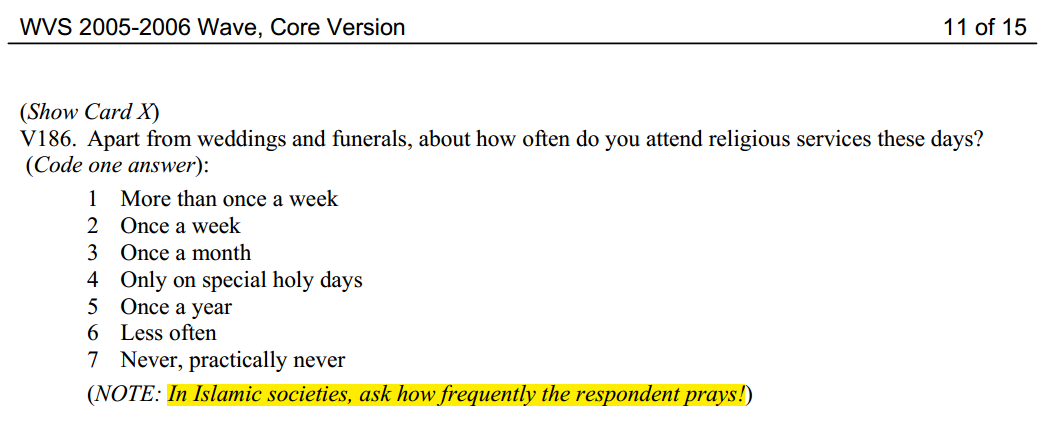 I’ve never noticed that note. As I figure it out, this is an attempt to overcome the widely known differences in church attendance between Muslims and Christians: Muslim women are not required to go to Mosque, whereas Christian women go to Church more frequently than Christian men (what about Buddhists?). So basically it says that there are two different questions asked in ‘Islamic societies’ and the rest of the world, which are stored in a single variable in WVS dataset. The use of different indicators for measuring the same construct is justified in the reflective measurement logic in which all the indicators are exchangeable, though I doubt it relates to a single-indicator measures. I checked questionnaire translations in “Islamic societies”, as it seemed to me too strange. What I found is even more surprising. Summing up, the question about praying only Morocco and Malaysia unambiguously asked about praying (though some troubles with options coding in Malaysia). The rest seven translations were either about attending mosques or ambiguous. Find below the detailed report. Thus, in general, we can quietly ignore The Note, just like the questionnaire translators did. To be serious - when using WVS or some other comparative survey data, every single question should be analyzed in (at least) the way I did it below, especially for your key variables and absolutely necessary for your dependent variables. Google is a handy tool, it gives a crude translation but you get a general idea of what’s in the question. You’ll find plenty of interesting surprises.
Social networks data collection tools
Collecting social networks data with R is highly beneficial since it can update results/graphs/reports on the air. Here are the basic ones:
All of them are based on the functions provided by httr or RCurl and work mostly using GET and POST web requests dealing directly with a corresponding network’s API. This is not too hard to develop your own tool for your specialized purposes, it will only take some time to get acquainted with specifics of your network’s API (which is usually quite simple). There are tools that integrate these packages with graphing and network analysis tools, such as SocialMediaLab.
Christian Welzel addresses my criticism
The following is Christian Welzel’s response he kindly provided following the post in which I summarized my criticism of his and Ronald Inglehart’s paper on measurement invariance:
This dismissive portrayal of our contribution does not come as a surprise. Indeed, no one who considers “internal coherence” as the prime criterion of measurement quality can be happy about our article. But that does not make the uncomfortable truth less true: the logic of internal coherence often prompts scholars to disqualify a multi-item construct as invalid, despite the fact that this very construct shows meaningful, important and powerful “external linkages” with its expected correlates. Scholars who advocate internal coherence as the gold standard of measurement quality offer no explanation of why weak internal coherence coexists so easily with strong external linkages. In fact, most of these scholars do not even address this phenomenon. Or they play it down, as if external linkages had nothing to do with a construct’s reality anchorage.
Is measurement invariance just a nonsense?
The short answer is No. But Christian Welzel has a different opinion. He and Ronald Inglehart have challenged the very common and largely accepted though sometimes tedious and uncomfortable practice of measurement invariance testing. I do not agree with them but their challenge provokes a lot of thoughts and clarifications in a current paradigm. Aleman and Woods (2015) were one of the few researchers who attempted to check Self-expression values index for measurement invariance across countries. Earlier, Hermann Dulmer and myself were trying to do more or less the same. I simply didn’t have my MGCFA models converged, there was too much non-invariance. Christian Welzel and Ronald Inglehart do not think that these tests make any sense.
Recent clarifications in age-period-cohort analysis
Update: The recent Bell and Jones’ paper summarizes the debate which occurred to be still on: https://link.springer.com/article/10.1007%2Fs11135-017-0488-5 Discussion between Reither et al. (Yang and Land among authors) and Bell and Jones This is a rare case of a long discussion between authors: there were four papers responding to each other by Reither et al. and Bell and Jones. The discussion is very recent, so maybe it hasn’t ended yet. (Actually, discussion appeared even earlier. It began with seminal Yang and Land’s 2006 paper, where they suggested to model period and cohort effects as a cross-classified structure with age at the individual level. Several responses from Bell and Jones followed, for example their 2014 paper was titled “The impossibility of separating age, period and cohort effects”, in which they clarified why the old task of identifying Age = Period + Cohort equation cannot be solved neither theoretically nor practically.)
Belief in a Zero-Sum Game by Różycka-Tran, Boski & Wojciszke paper in JCCP, 2015 reviewed
Różycka-Tran, J., Boski, P., & Wojciszke, B. (2015). Belief in a zero-sum game as a social axiom: A 37-nation study. Journal of Cross-Cultural Psychology, 1, 24. pdf
A group of Polish psychologists has expanded the list of social axioms with a very intriguing one. They called it “belief in a zero-sum game” which is a belief that if someone gets anything it means someone else has lost it. The concept of zero-sum game was adopted from game theory, but it’s not very popular in cross-cultural research. This is a very important concept in institutional economics, where the zero-sum game mimics the imperfect institutions that can shape how people behave. In the reviewed paper the authors were interested not in institutional conditions but rather in perceptions of these conditions. This issue matters particularly in relation to cultural barriers of economic development. Potentially, a production of added value is problematic if no one believes it’s possible. The previous findings from Polish samples showed that people who believe that the game has zero-sum, are generally the ones who used to lose. This is a clear tendency of a personality to keep its psychological balance - “I didn’t win, because the others took my win” (not “because I wasn’t able to”). Using psychology student samples from 37 nations the authors measured this belief with a battery, including 8 items such as “when somebody gains, others have to lose”, “person wins only when others lose”, and surprisingly “interests of different people are inconsistent” and “When someone does much for others, he or she loses.”
Review of Polavieja's "Capturing Culture" ASR paper
update 10.08.2018. I have just discovered that the paper received critical comments which surprisingly do not overlap with mine. The difference is these comments were published in ASR and rejoined by the author.
Capturing Culture: A New Method to Estimate Exogenous Cultural Effects Using Migrant Populations by Javier G. Polavieja // American Sociological Review, February 2015, vol. 80, no. 1, pp. 166-191. http://asr.sagepub.com/content/80/1/166.abstract
The paper is a bit hard to comprehend, so I spent a long time trying to understand and being very sceptical about it. But finally, I got the general idea and it seems pretty good. In short, the paper is about how to construct a good instrumental variable for IV regression when you have endogeneity (i.e. - always) and use data from cross-country surveys. The author suggests using country of migrants’ origin in constructing of the IV for a regression based on migrant samples. The characteristics of native populations are assigned to migrants and this variable is a good IV since it’s completely exogenous to the sample. After instrumenting, a regressor reflects only the variance that is due to differences in migrants’ country of origin. 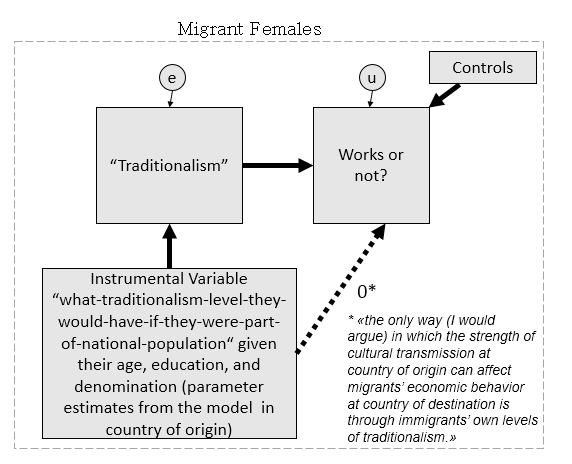 What I disliked is a specific implementation of the idea.
Welzel and critics
* all the articles have been published in Journal of Cross-Cultural Psychology, below are abstratcs
A Comment on the Index of “Self-Expression Values,” by Inglehart and Welzel
Eduard J. Bomhoff and Mary Man-Li Gu
http://jcc.sagepub.com/content/43/3/373.abstract
Ronald Inglehart and Christian Welzel have made two strong claims for the index of “selfexpression
values” introduced in 1997 by Inglehart using responses from the World Values
Survey (WVS): first that these values are getting stronger worldwide and second that this is a
necessary condition for a flourishing democracy. In this research note, we document that the
shift to more emphasis on tolerance, trust, and post-materialism—principal components of
the self-expression index—is indeed visible in many countries, but not in East Asia. Also, the
combination of these components into one index is fine on average, but makes little sense for
the East Asian region. Many East Asians maintain some different attitudes toward work, family,
and social issues that would appear traditional and conservative by today’s Western standard
where such conservative values today are held typically by people who are less trusting and
more suspicious of democracy. By contrast, trust, measured in six different ways, as well as
post-materialism, appears compatible with these conservative work and family values in East
Asia. The claim that self-expression values as defined by Inglehart are a necessary condition for
a healthy democracy makes sense in many parts of the world, but not in East Asia.
The Myth of Asian Exceptionalism: Response to Bomhoff and Gu
Christian Welzel
http://jcc.sagepub.com/content/43/7/1039.abstract
In a series of contributions, Welzel describes modernization as human empowerment: a process
that emancipates people from external authority. Human empowerment theory (HET) posits
two sequential mechanisms. First, cognitive empowerment through rising levels of education and
knowledge leads to motivational empowerment, manifest in rising emancipative values. Second,
rising emancipative values nurture mass aspirations for liberal democracy, leading to more effective
democratic practices. Using World Values Survey (WVS) data from a dozen Asian societies,
Bomhoff and Gu claim that Asia is different because these mechanisms do not work among
Asian societies. Against these claims, this response shows that Bomhoff and Gu’s results are
inconclusive. Upon proper examination of WVS evidence, their conclusions turn actually into
the opposite: The emancipative logic of HET applies to Asia as much as it applies to the “West.”
East Asian Exceptionalism — Rejoinder
Eduard J. Bomhoff and Man-Li Gu
http://jcc.sagepub.com/content/43/7/1055.abstract
This short note calls for a more careful examination of value patterns in East Asia, focusing on
the applicability for that region of the Self-expression Index constructed by Welzel (2005). We
show that in East Asia, acceptance of homosexuality, a core component of the index, has a correlation
with the other components that is opposite to what we observe in the rest of the world.
Further analysis indicates that conservative attitudes toward homosexuality in East Asia have no
negative influence on undermining people’s aspirations for democracy. Such an anomaly provides
strong empirical evidence that the Self-Expression Index has limited cross-cultural validity.